 Jeremy Norman’s
HistoryofInformation.com Exploring the History of Information and Media through Timelines
Jeremy Norman’s
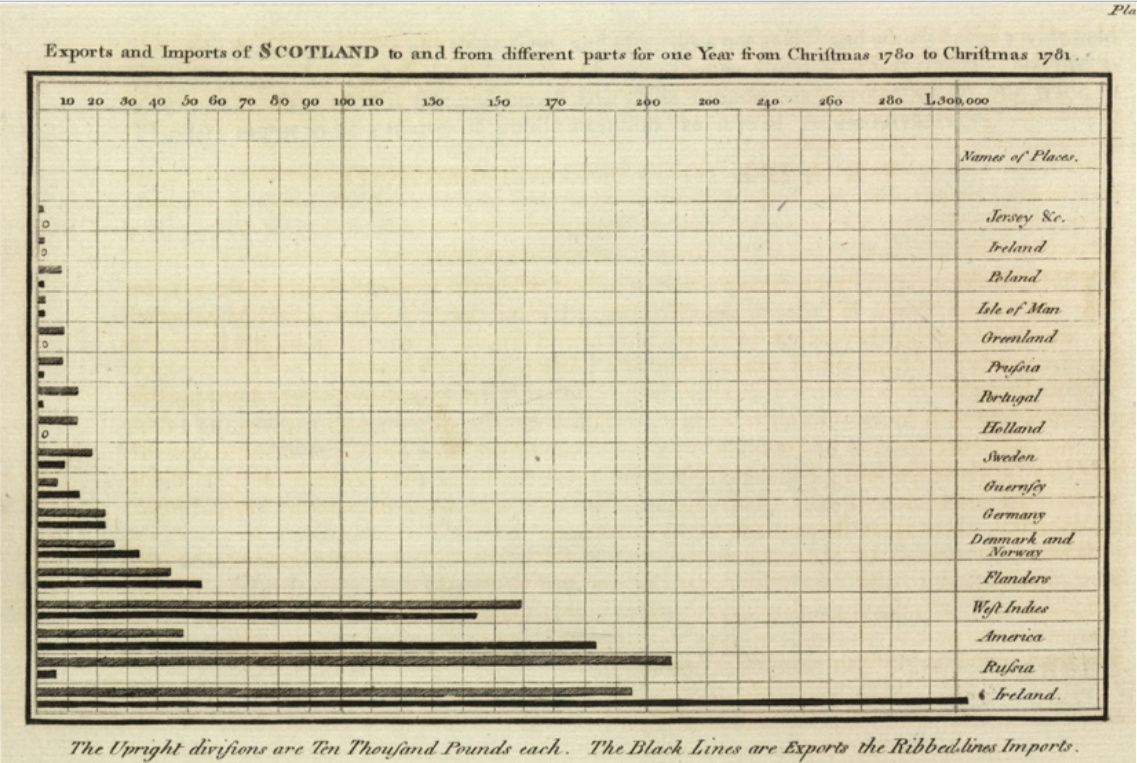
Playfair's bar chart showing Exports and Imports of Scotland to and from different parts for one Year from Christmas 1780 to Christmas 1781.


A: London, England, United Kingdom

Playfair's trade-balance time-series area chart from his Commercial and Political Atlas. Playfair is usually credited with inventing area charts.
In 1785 Scottish engineer and political economist William Playfair issued in London a privately circulated preliminary edition of his The Commercial and Political Atlas; Representing, by Means of Stained Copper-Plate Charts, the Exports, Imports, and General Trade of England, at a Single View.
The next year Playfair formally published the work in London with an even longer title as The Commercial and Political Atlas; Representing, by Means of Stained Copper-Plate Charts, the Exports, Imports, and General Trade of England, at a Single View. To which are Added, Charts of the Revenue and Debts of Ireland, Done in the Same Manner by James Correy. For this work Playfair invented the line chart or line graph or times series plots, present in the book in 43 variants, and the bar chart or bar graph, represented by a single example. The first 10 plates were engraved by Scottish engraver and cartographer John Ainslie in 1785 for the preliminary edition; the remainder were engraved by Samuel John Neele. It is thought that Playfair, often short of funds, may have hand-colored the charts himself—the coloring process that he curiously designated as "staining" in the titles.
As one inspiration for his information graphics concerning economics and finance, Playfair cited Priestley's timelines as published in his New Chart of History.
"Over the course of the next half century, Plafair's line graph, which counterposed two quantitative axes, (one for time, the other for economic measures such as exports, importants and debts) became on of the most recognizable chronographic forms" (Rosenberg & Grafton, Cartographies of Time [2010] 136).
"Playfair had a variety of careers. He was in turn a millwright, engineer, draftsman, accountant, inventor, silversmith, merchant, investment broker, economist, statistician, pamphleteer, translator, publicist, land speculator, convict, banker, ardent royalist, editor, blackmailer and journalist. On leaving Watt's company in 1782, he set up a silversmithing business and shop in London, which failed. In 1787 he moved to Paris, taking part in the storming of the Bastille two years later. He returned to London in 1793, where he opened a "security bank", which also failed. From 1775 he worked as a writer and pamphleteer and did some engineering work" (Wikipedia article on William Playfair, accessed 03-16-2010).
In 2005 the third edition (1801) of Playfair's atlas with the first edition (1801) of the breviary were reproduced in color as Playfair, The Commercial and Political Atlas and Statistical Breviary, Edited and Introduced by Howard Wainer and Ian Spence.